- Date
- 2023-03-21
- Version
- 1.2
- Copyright
- This file is part of stegocurve.
stegocurve is free software: you can redistribute it and/or modify it under the terms of the GNU General Public License as published by the Free Software Foundation, either version 3 of the License, or (at your option) any later version.
stegocurve is distributed in the hope that it will be useful, but WITHOUT ANY WARRANTY; without even the implied warranty of MERCHANTABILITY or FITNESS FOR A PARTICULAR PURPOSE. See the GNU General Public License for more details.
You should have received a copy of the GNU General Public License along with stegocurve. If not, see http://www.gnu.org/licenses/.
Description
This tool is provided to help researcher to plot easily the embedding efficiency as a function of relative payload for code based steganography; as a fronted of gnuplot, pgfplots or tikz.
How to use it?
Compilation
The tool stegocurve was developped in ANSI-C from scratch. The compilation is done with a makefile. We can use the command make in following way :
Then stegocurve will be compiled and the running file will be in the directory ./bin/ . Then to running it, run :
The makefile propose the following option:
- doc : generate all the documentation thanks to Doxygen. The documentation files are available in the directory doc in html form.
- all : compile the project and the full documentation.
- clean : remove all object and temporary files (.o, *~).
- distclean : is equivalent to clean and remove the running file ./bin/stegocurve
- tarball : is equivalent to distclean and make a archive in .tar.gz in the parent directory.
Execution
Plot curve of efficiency of code based steganography need two step:
- generate the data file;
- create a gnuplot file and plot in eps and pdf formats.
It is why there is two possible actions with stegocurve. The first one is the generation of data files.
where DataDirectory is a mandatory option and indicates where the data files will be created. If the directory DataDirectory does not exist, then it will be created. Otherwise, if it exists with old data files, then they will be removed by the new ones.
The second possible action with stegocurve is plotting the needed curves with:
where the following options are mandatory:
- PLOTTER is the plotter choice, the possible values are gnuplot, mathplotlib, pgfplots and tikz;
- datafilei the data file generated by the action generate of stegocurve ;
- namei the name of the curve in the plot of the previous data file;
- outputname the name of the output file where will be plot the data files.
Error
When an error occur in the argument sequence, the following message will appear, in stderr, which is usually the current terminal:
When this message happends, it means that there is a problem with the argument sequence.
Examples
Since a pratical example is better than a long explanation. Firstly, we have to generate data files:
We can check that the data were well created:
Now, we can create the curves with the wanted ploter. If I wish to compare the binary Hamming codes in the worst and average case (i.e. wc, ac), we need to run stegocurve in the following way:
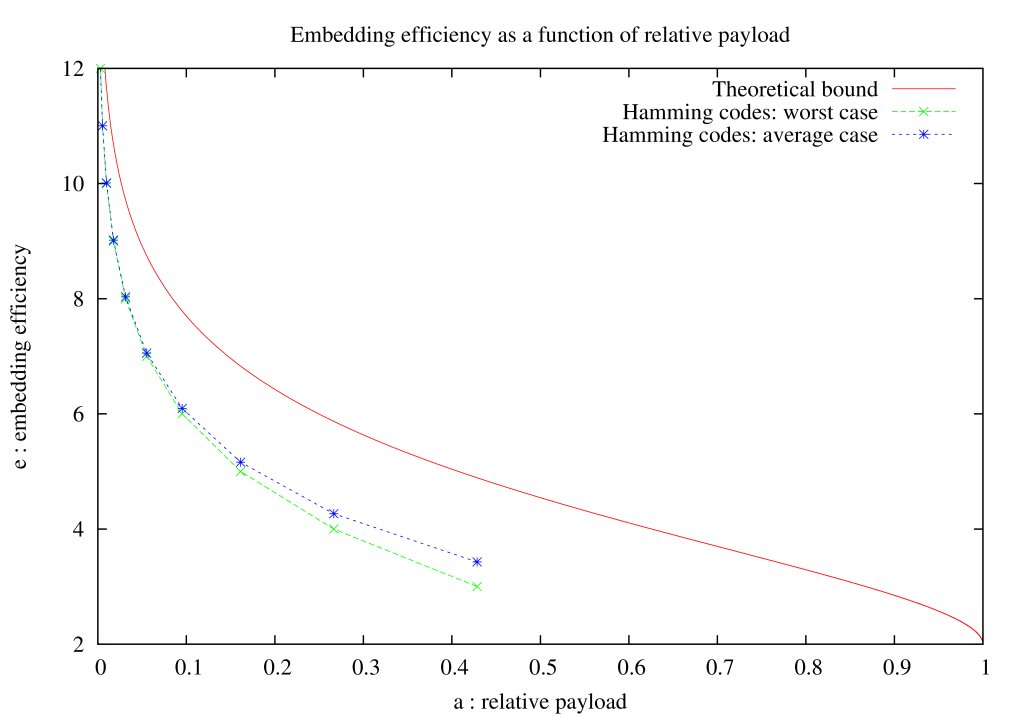
- with gnuplot: $ stegocurve gnuplot data/entropy_2.dat "Theoretical bound" data/Hamming_wc.dat "Hamming codes: worst case" data/Hamming_ac.dat "Hamming codes: average case" Hamming
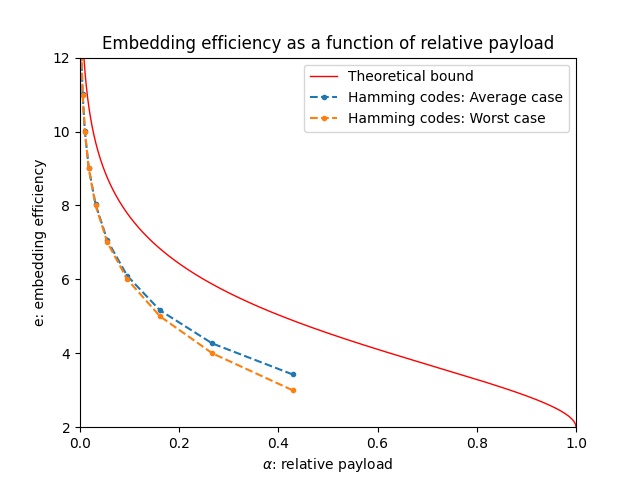
- with matplotlib: $ stegocurve matplotlib data/entropy_2.dat "Theoretical bound" data/Hamming_wc.dat "Hamming codes: worst case" data/Hamming_ac.dat "Hamming codes: average case" Hamming
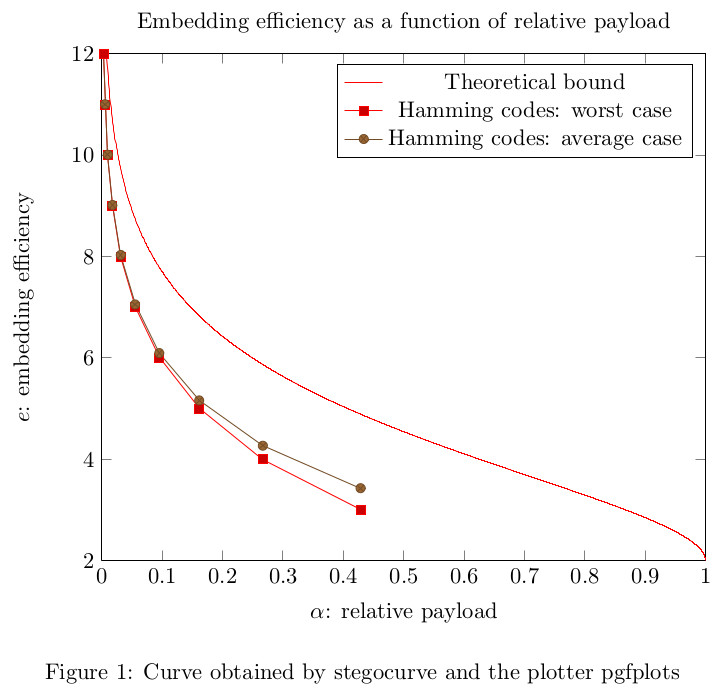
- with pgfplots: $ stegocurve pgfplots data/entropy_2.dat "Theoretical bound" data/Hamming_wc.dat "Hamming codes: worst case" data/Hamming_ac.dat "Hamming codes: average case" Hamming
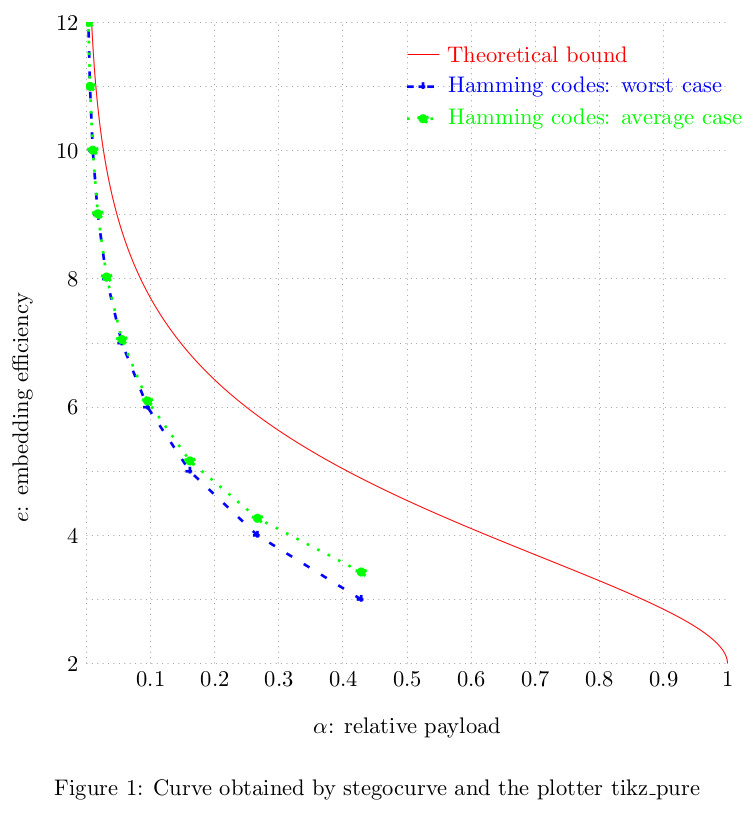
- with tikz: $ stegocurve tikz data/entropy_2.dat "Theoretical bound" data/Hamming_wc.dat "Hamming codes: worst case" data/Hamming_ac.dat "Hamming codes: average case" Hamming
It results the following image:
- With the plotter gnuplot
- With the plotter matplotlib
- With the plotter pgfplots
- With the plotter tikz
If you want to change the used styles of the plotter P, you can change functions in ./src/plotters/plotter_P.c and re-compile and re-run stegocurve, and the modifications will be permanent.
How to fit the config file?
The configuration file is an alternative to the command line arguments to manage the behavior of stegocurve. This is the only manner to use stegocurve for the windows users.
The only one condition in order to the parser of stegocurve can read correctly your setting in the configuration file is to put the wanted value between ' or ".
We propose the following example to generate the previous curve with the plotter pgfplots:
This configuration file is equivalent to the following command line
How to add new data?
To add new data, two choices are available:
- contact the author to add your parameters in the next version: morgan.barbier@ensicaen.fr;
- follow the following sections and contact the author in order to spread your result.
From now, we assume that you wish to add parameters for the codes familly F.
Add parameters
The first step consists in to create the file ./src/F.c and ./inc/F.h in order to create at least three functions:
- a function to initialize one code with a parameter;
- a function to initialize a familly of codes; is just a frontend of an existing generic function;
- one or two functions to print the data, is also just frontend of existing generic functions.
Init one code
The prototype of the function to initialize one code is
we replace F by the name of the family; and where
- Code *C : is a pointer to the code to initialize;
- const uint parameter : is an unsigned int which permit to identify which code.
Keeping in account the argument parameter, you can use the following existing functions to initialize your code, it depends of your needed:
click on functions to have more details about it.
Init codes family
The prototype of the function to initialize codes family is
where
- Code *C : is an allocated array of codes to initialize;
- const uint start : is the first parameter such that the function init_F_code() will be call;
- const uint nb : is the number of codes in the family, and so the number of codes allocated in the array C.
This function is just a frontend of an existing generic function, and usually can be define as
Print data
If in the function init_F_code() you were able to provide parameters in the worst case then you have to define a fronted function F_codes_WC(). Likewise, if in the function init_F_code() you were able to provide parameters in the average case then you have to define a fronted function F_codes_AC().
To give a more precise example, assuming that for the codes family F we are able to define the average and worst case for 5 codes of F with starting parameter 3. The generated data file will have for name filename.
Generate data file
To generate the new data file to plot it, you have to add in function generate_all() of the file ./src/main.c a call to your previous function F_codes_WC().
All modifications were done! Now compile and enjoy!